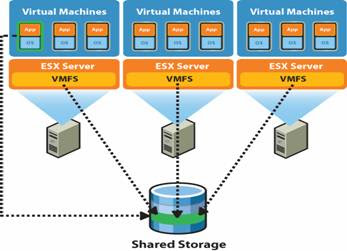
Below are
some back end metrics available on the back end storage array
These are typical performance metrics showing
throughput and response times, the type of thing you need to report on
regularly so that you can be on top of performance before incidents start being
generated.
Performance Capacity – Array Metrics
The key
metrics that you need to get a handle on at volume level are throughput,
response and latency.
Below an
example of NetApp metrics at volume level
Below an example of metrics within EMC at the volume level
The read/write ratio can give you an idea of what your work profile looks like.
Performance Capacity – Component
Breakdown
The
example below, using athene, shows a
component breakdown for the server.
It’s
essential to know whether you have any queuing going on (shown in yellow above)
as if queuing is happening you are exceeding the devices throughput rate.
In the
final part of my blog series on Monday I’ll take a look at workload profiles,
scorecards and dashboards.
Dale
Feiste
Principal
Consultant


