Monday, 29 February 2016

Key Metrics for Effective Storage Performance and Capacity Reporting - Response Impacts (7 of 10)


SAN or storage array performance problems can be identified at the host or backend storage environment.

The diagram below shows a typical performance impact in the more complex environment.


With SAN attached storage you can share storage across multiple servers, one of the downsides of this is that you can have storage response impact across multiple servers too.

Performance Capacity – Host Metrics

It's important that you understand the limitations of certain host metrics.

A selection of host metrics are shown below:


        Measured response is the best metric for identifying trouble.
        Host utilization only shows busy time, it doesn’t give capacity for SAN.
        Physical IOPs is an important measure of throughput, all disks have their limitation.
        Queue Length is a good indicator that a limitation has been reached somewhere.

Performance Capacity – Host Metrics
Metrics like host utilization can indicate impactful events, but ample capacity might still be available.


The high utilization can be seen generating large amounts of I/O in the chart below.


Queue lengths indicate that it may not currently be impacting response, but headroom is unknown. Response time is the key, as users will be impacted if it goes up.

On Wednesday I’ll be taking a look at array architecture.

Dale Feiste
Principal Consultant

Friday, 26 February 2016

Key Metrics for Effective Storage Performance and Capacity Reporting - Virtual Environments and Clusters (6 of 10)


Managing storage in clustered and/or virtual environments can be challenging because it is shared among all hosts and virtual machines running on it.   

Below is an example of a simple 3 node  VMware cluster going to some shared storage.


Features that are available

        Thin provisioning
        Storage can be viewed at many levels.
        Could be different tiers allocated to the same cluster
        Overhead at various points


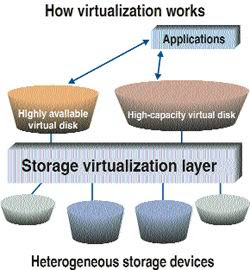
Storage Virtualization

There are advantages to the layered system

        it allows a caching layer so that you may not have to go all the way to the backend to satisfy an I/O request
        there are a lot of administrator features regarding allocation and replication
Pooling physical storage from multiple sources into logical groupings is useful

        Can be a centralized source for collecting data
        If using as a data source beware of double counting with backend


There are a wide variety of techniques for virtualizing storage, be aware of the implications for data collection and reporting.

On Monday I’ll be discussing response impacts on performance capacity and metrics for these.

Dale Feiste
Principal Consultant


Wednesday, 24 February 2016

Key Metrics for Effective Storage Performance and Capacity Reporting - Host Metrics (5 of 10)


Moving on to the metrics, for occupancy the key metric is utilization. How much storage are we using and how much is available?

Below are some host metrics that are typically available, these metrics are available at the file system, volume, or logical disk levels.


Array Metrics 
The illustration below shows an example of occupancy metrics from the array perspective. This is an example of Netapp filer aggregate metrics (down at the aggregate level).


A lot of these Storage arrays, from the different vendors, have different ways to carve up the storage.  Storage groups can be configured as in this example, using NetApp aggregates, which can have many occupancy metrics at different levels.
Some of the NetApp occupancy levels here are not available on the host in general.

I’ll pick out a few of the metrics:
De-dupe – If this is turned on you can find out how much space you’re saving
Total Committed space – A lot of vendors now offer thin provisioning where storage can be over-committed so it looks as though there is more storage than is really available, this allows you to see how over-committed you really are.
athene®, our capacity management solution, brings in metrics from any data source so storage metrics can be part of the overall capacity management process.

On Friday I’ll be taking a look at Virtual Environments & Clusters.

Dale Feiste
Principal Consultant


Monday, 22 February 2016

Key Metrics for Effective Storage Performance and Capacity Reporting - Trending (4 of 10)

One thing to keep in mind for trending is to understand the limitations of linear regression when trending and forecasting data.

I’ve used the graphs below as an example of this.


In the second graph you can see what will happen eventually when that bottoms out or someone goes in and allocates more storage or frees more storage up – it skews the trend line.


Space Capacity – Different Viewpoints
We’ve talked about different viewpoints when looking at your data, reports, trending and now I’m going to look at how useful it is to look at things in Groups.
You can group by Business, Application, Host, Storage Array, Billing Tier and what that really boils down to is providing more of a business or application view.
Below you can see this has been grouped to provide a commercial/business and a technical view. Application owners can go in and see how much storage they are consuming, particularly useful if you also include billing information.


Join me again on Wednesday when I’ll be discussing Host Metrics and don't forget to register now to come along to our next webinar 'Maturing the Capacity Management Process' http://www.metron-athene.com/services/webinars/index.html

Dale Feiste
Principal Consultant


Friday, 19 February 2016

Key Metrics for Effective Storage Performance and Capacity Reporting - Space Utilization (3 of 10)


What does storage ‘Utilization’ mean in your environment?


Utilization can be a variable definition and there are many factors to take in to account, these include RAID/DR, Raw/Configured, Host/SAN, Backups, Compression, Etc...

The term utilization can depend on whether you are including any of these factors and it is useful to know exactly what you wish to include and report on when determining whether you have under or over-utilized storage capacity.

Occupancy – Visibility

Once you have defined what you wish to include in your reports you can start collecting the data.


The chart below illustrates space used on a file system and is a regular trend chart with a threshold, as you can see moving out in to the future it is going to exceed the threshold. You can use trending to report on a number of metrics but when an application is going to run out of space it is going to be at this level.

It’s advisable to be pro-active with trending to ensure that you can deal with any problems before they turn in to real performance problems.


Technical solutions can then be implemented to optimize storage space management, including databases.

On Monday I’ll be looking at Trending and Groups.

Dale Feiste

Principal Consultant


Wednesday, 17 February 2016

Key Metrics for Effective Storage Performance and Capacity Reporting - Two Distinct Aspects of Storage Capacity (2 of 10)


Today let’s take a look at the two distinct aspects of data storage.

Data can come from all different directions to the disk.


Disk occupancy

Disks used to be very expensive but now the costs have come down dramatically and this cost factor has accelerated the growth of storage.

You may have too little storage resulting in out of disk space problems but conversely you may have storage over-allocated. A lot of times people put excessive storage space out there to ensure that they never run out and don’t pay attention to how much they really need and what their growth really is going to be.
Below is a typical service center queuing diagram


Disk Performance Capacity

Response, IOPs

In many cases the requests are being sent out by an application or applications. There is a finite limitation on the requests per second that can be satisfied and then a queue begins to form. The queuing theory comes in to play where you have limitations on the throughput of your I/O and at some point this will have a response impact. The response impact transfers up through the application to the user and results in a slow response time, a performance problem.

On Friday I’ll be looking at space utilization, in the meantime why not sign up to our Community and get access to our great resources, free white papers, on-demand webinars and more.http://www.metron-athene.com/_resources/index.html

Dale Feiste
Principal Consultant


Monday, 15 February 2016

Key Metrics for Effective Storage Performance and Capacity Reporting (1 of 10)


This blog series will cover the key metrics in storage that you can use to get a handle on your storage capacity.


        Storage Architecture – basic concepts

        Two distinct aspects of storage capacity

        Virtualization

        Key metrics from the host and backend storage view

        Reporting on what is most important

I’ll start with the history of storage architecture.

Storage has increased in complexity, as shown in the diagram below, from left to right


Large environments have gone from megabytes to petabytes in terms of Storage and this growth can result in an increase in cost and complexity. 

On Wednesday I’ll look at the 2 distinct aspects of storage capacity.


Dale Feiste
Principal Consultant


Wednesday, 10 February 2016

Why carry out a Gap Analysis?

Increasingly organizations need to justify that processes and procedures used throughout the business meet industry standards for good practice, and can be audited and proven to be so. This gives stakeholders in your business and in-house staff the confidence that expenditure in the business is being optimized.

ITIL is the leading approach for good practice in the management of IT infrastructure and its interaction with the business.  By understanding ITIL’s position for all infrastructure management processes and implementing what is appropriate for your organization from within those guidelines,you can justify to stakeholders that your environment is being managed in line with or better than industry expectations.

Effective adoption of the ITIL approach to good practice means understanding what is good and bad in your environment, what is needed to make your organization more effective and bringing these together as a set of processes and procedures that help your business achieve its goals.

Often a gap analysis is undertaken in-house but many organizations are now opting to use external Consultants, as their impartiality is invaluable.  One of the biggest challenges when implementing business level processes is being able to interface with the appropriate areas of an organisation.  The impartiality that external consultants provide, allows for a better dialogue and without the internal politics that may restrict the flow of information.

Our Gap Analysis service helps define your understanding of where you are, where you should be, and how to get there in terms of Service Management and is one of many services that we offer in our Professional Services division.
http://www.metron-athene.com/services/consulting/index.html


Jamie Baker
Principal Consultant