Wednesday, 26 September 2012

vSphere vs Hyper-V Performance showdown - Hyper-V dynamic memory in action


Hyper-V dynamic memory in action

During the tests I found some interesting observations with dynamic memory which I would like to share with you.
High Pressure
I took this screenshot when the tests were running. You can see that during the test a warning status was activated, which alerted that memory demand of 1346 MB was exceeding the assigned memory of 1077 MB, and at this point the memory balancer kicked in. This was a point in time where pressure would have shown as over 100 on our chart.


Low Pressure

From this screenshot you can see that assigned memory is set at 2352 MB but demand is well below that – in this case the balancer will take away memory as it was not required.

 
Random I/O on Dynamic Disks
A comparison below confirms the problem I encountered with random I/O on dynamic disks and the fixed disk performed much better.
 
Conclusions, Caveats, and Final Thoughts
The overall the combined results for vSphere and Hyper-V were surprisingly close.

Individual tests produced some interesting findings
 
·        Windows CPU performance on Hyper-V was significantly slower
·        Two vCPUs running a single process had little negative impact
·        Random I/O on a Hyper-V dynamic disk had terrible performance
·        Hyper-V dynamic memory worked great with no performance penalty, from a management perspective a really good feature.
Caveats

·        Workloads were very general and dependent on perl implementation
·        Many more variables could be taken into account
·        Result will be different on other hardware
 
That wraps up my vSphere vs Hyper-V showdown series - remember running benchmarks in your own environment should be done to help you make the best informed decisions.
 
Dale Feiste
Consultant


Monday, 24 September 2012

vSphere vs Hyper-V performance showdown - I/O metrics


I’ve selected a handful of I/O metrics to show you

 
·        vSphere queue latency

·        vSphere device latency

·        Hyper-V disk throughput

 
vSphere Queue Latency
There are different metrics across different platforms and some platforms do not have matching metrics. Queue latency is an example of this as it is available in vSphere but not in Hyper-V.
 
 
During the test you can see that I/O queue latency was minimal, which was a little surprising and means that the I/O was going through on demand.
 
vSphere Device Latency
This shows the actual response time from the device and when the tests were running this spiked up.
 
 
Hyper-V Disk Throughput
This shows the overall read/write at bytes per second, the spikes show where the large file was being written out. When reading there was more caching going on and less I/O, which is what you would expect.
 
These have been some examples of the types of metrics that you would be likely to use and analyze.

During the tests I found some interesting observations which I'd like to share with you on Wednesday.
 
Dale Feiste
Consultant


Friday, 21 September 2012

vSphere vs Hyper-V showdown - Memory


As promised on Wednesday let’s move on to take a look at Hyper-V.

Memory Details - Hyper-V Memory Balancer Pressure

The graph below looks at average memory from the host perspective –as you can see the pressure goes up to over 100% and then drops back down.
 
 
The pressure is the ratio of memory allocated compared to memory demand. You won’t ever see this go over 100% as this is at host level, as the operating system balancer will kick in and provide memory where it’s needed.
 
Memory Details - Hyper-V Memory Current Pressure
The next chart here is memory pressure from the virtual machine perspective, which is more granular.
 
 
You will see there is a buffer setting that you configure when you set up dynamic memory, and the buffer setting in this case was 20, which kept normal pressure at 80. When the test started you can see that it went way up over 100 which means that the demand was greater than the allocation in the virtual machines. The balancer would then kick in to provide more memory and you can see the pressure oscillating back and forth.

This test showed that the memory balancer is working effectively.
 
Memory Details - Hyper-V Pages Allocated
In this next chart you can see that pages are being allocated dynamically during the test, based on need.


On Monday I’ve selected a handful of I/O metrics to show you.
 
Dale Feiste
Consultant


Wednesday, 19 September 2012

v-Sphere vs Hyper-V showdown - Memory metrics


I’ve selected three memory metrics for each platform to look at: 
 

·        vSphere memory consumed by VMs

·        vSphere memory ballooning

·        vSphere paging

·        Hyper-V memory balancer average pressure

·        Hyper-V memory current pressure

·        Hyper-V physical page allocation
 
 
I'll cover vSphere today.
 
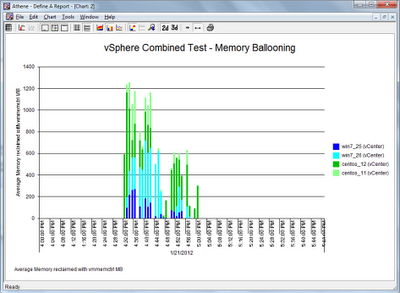
Memory Details - vSphere Ballooning
You can see from the graph below that vSphere was doing memory management as there was significant ballooning taking place.
 
 
Memory Details - vSphere Paging
The interesting thing to note here is that it paged out when running the individual tests, the spikes occur when the combined tests started to run and then it dropped.
 
 
Memory Details - vSphere Consumed
The graph below illustrates the memory consumed by paging.
 
I looked back to see how that compared with my previous graph and there is some correlation between memory consumed and paging. It would be interesting to see on a separate analysis, at another time, how this relationship plays out and if you’re looking for more details on this I believe there was a session on this at VMworld.
 
On Friday  I'll take a look at Hyper-V.
 
Dale Feiste
Consultant


Monday, 17 September 2012

vSphere vs Hyper-V showdown - CPU details

The following set of charts show some metrics from both platforms that I collected using athene to use on an ongoing basis for my capacity management.

Hyper-V is dark blue and vSphere light blue, shown side by side.


CPU metrics
Some metrics that are worth monitoring, how much time the virtual CPU is waiting for a ‘slice’ of the physical CPU:
 
·        vSphere VM ready time
·        Hyper-V Guest run time 
 
CPU Details - vSphere CPU Ready Time
 
All 4 machines were running and I chose to view them as a stacked chart.
 
 
You can see from the graph how it ‘spiked’ however the reality is that this is being viewed by percentage, so they weren’t actually waiting for too long.
 
CPU Details - Hyper-V Guest Run Time
 
This is a single metric guest run time.
 
 
One interesting feature is that this spiked up over 100% on two occasions.
 
On Wednesday I’ve selected three memory metrics for each platform and we’ll be taking a look at those.
 
Dale Feiste
Consultant


Friday, 14 September 2012

vSphere vs Hyper-V showdown - Results - Individual VM Memory,Network and Grand finale


Results - Individual VM Memory and Network

If you’ve been following my series you’ll know that today is the grand finale, I’ll be looking at the test results for all workloads running at the same time on multiple VMs.

Before we get to that the next tests I conducted were for memory using a memory consumption script.


I wanted to determine whether there was an impact on the dynamic memory. The windows allocation was faster in this case and seemed to be utilizing its memory better with no negative impact from using dynamic memory.
 
I ran a network test next ....
 
Results - Individual VM Network
 
As  mentioned previously I would need to run more tests to see the levels of variability, but there was a slight advantage for vSphere.
 
 
and now the test results for all workloads running at the same time on multiple VMs, the winner is..........
 
 
It was a draw!
Overall I was pretty surprised at how evenly matched the two were when running multiple workloads simultaneously.
On Monday I’ll show some metrics from both platforms that I collected using athene, to use on an ongoing basis for my capacity management.

Dale Feiste
Consultant


Wednesday, 12 September 2012

vSphere vs Hyper-V showdown - Results - Individual VM Disk


Results - Individual VM Disk

Today I’ll be looking at the results for individual VM Disk.


Write out a 512mb file.
 

You can see that vSphere took a little longer than Hyper-V to write.

The next step was to read in the 512 MB file, and I think there was a lot of caching going on with this sequential read.
 
Read the 512 MB file
 
 
There is a noticeable anomaly, but the absolute numbers are small and read times are pretty quick. I believe this would need more sampling to see how much variability exists.
 
The final disk test was an intensive random I/O script that looped through reading and writing  with the 512mb file. This one definitely had a negative impact on Hyper-V.


I call the performance abysmal for Windows on Hyper-V as it essentially just ‘fell over’. Dynamic disks were configured for the VMs, and after this surprise result some research turned up a recommendation from Microsoft that static disks should be used for random I/O. These test results are a good illustration of why benchmarking is important. Bear this in mind and create static disks up front for random I/O until this issue is confirmed to be resolved. I attempted to convert the dynamic disks to static and the wait time was longer than my patience.
 
Summary of disk I/O results
Random I/O on a Hyper-V dynamic disk had terrible performance, so remember to create static disks.
 
On Friday I'll be showing you the test results for Individual VM Memory.
 
Dale Feiste
Consultant


Monday, 10 September 2012

vSphere vs Hyper-V showdown.Results - Individual VM CPU


Individual VM CPU

There may be variability in the numbers that is not captured in these tests, as this was a small sample. Red bars represent the Hyper-V environment and blue bars represent VMware in all the following graphs, and time is in seconds – so the lower the better.

The first individual test I ran is a single CPU running a single process and there is a little bit of an anomaly shown here, as surprisingly Win7 on Hyper-V appears slower.


I ran the single process with an extra vCPU and didn't see any negative impacts, no degraded performance but it didn't help either.


I then ran twice the amount of work in the same time using two processes.
 
Summary of CPU results
 
To summarize 
 
·        Windows CPU performance on Hyper-V was significantly slower
·        Two vCPUs running a single process had little negative impact.
 
On Wednesday I'll show the results for an Individual VM Disk.
 
Dale Feiste
Consultant


Friday, 7 September 2012

vSphere vs Hyper-V - Test Environment and Testing Methods


This is the test environment that I used to make the comparisons:

 
·        AMD Phenom II 3.3 GHz

·        8 GB RAM

·        1TB Hitachi 7200 RPM HD SATA 2 interface

·        1GB Onboard network interface

·        vSphere 5

·        Hyper-V role installed on Windows 2008 R2 SP1

·        2 x Windows 7 SP1 VM with integration services

·        2 x CentOS 6.2 VM with integration services v3.2

·        Simple custom benchmarks using ActiveState perl v5.14

·        cpu.pl, disk.pl, mem.pl, net.pl scripts
 

Testing methods


The Hyper-V dynamic memory feature was enabled on Windows VMs, as that was one of the main features I wanted to look at. A starting minimum memory value of 512 MB was configured for the Windows VMs.
Linux VMs were statically configured with 2GB and the memory script was calibrated to use between 1.5 and 1.8GB of RAM.
Two of the machines were configured with 2vCPU’s rather than 1, and no pass-through I/O was used.
Both individual and combined VM workload tests were run as outlined in the graphic above.
 
On Monday I'll start showing you the results of the tests.
 
Dale Feiste
Consultant