There are many Reporting Processes but those that are useful in helping you manage your monthly license charges are below:
•
Analyze the Peak Workloads
•
Review workload placement - can workloads be combined
onto a single LPAR?
•
zIIP processor usage
Some examples
below of the type of reports you can create, these have been produced using our
athene® ES/1 product.athene® ES/1- Rolling 4 Hour Average
athene® ES/1- Rolling
4 Hour Average w/ Service Classes
How to calculate MLC
•
Calculation
is made for the period from the 2nd day of the month to the 1st
day of the next month.
•
MLC
is charged based on the maximum value of total R4HA MSU of all LPARs during the
calculation period.
•
Charge
for each IBM software product is made for the period while the product is running.
(Except z/OS)
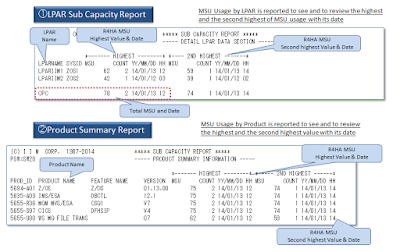
SCRT – Sub-Capacity Report Tool
athene® ES/1
provides all the information used with the SCRT(Sub Capacity Report Tool). The information provided is shown from the
LPAR and Product perspective.
Shown on the
report are the highest and second highest values and the date/time they
occurred.
Sample Charts for IBM MLC
athene® ES/1 product usage
Helping you to correlate software
charges and application usage.
Business Transactions vs. CPU Usage – Change chart
On Wednesday I'll conclude my series with a look at the way you can manage costs, on that day I'll also be broadcasting live with my 'Top 5 z Systems Capacity Issues' - make sure you register for your place.
Charles Johnson
Principal Consultant


No comments:
Post a Comment