Today I’ll show you one final report on VMware, which looks at headroom available in the Virtual Center.
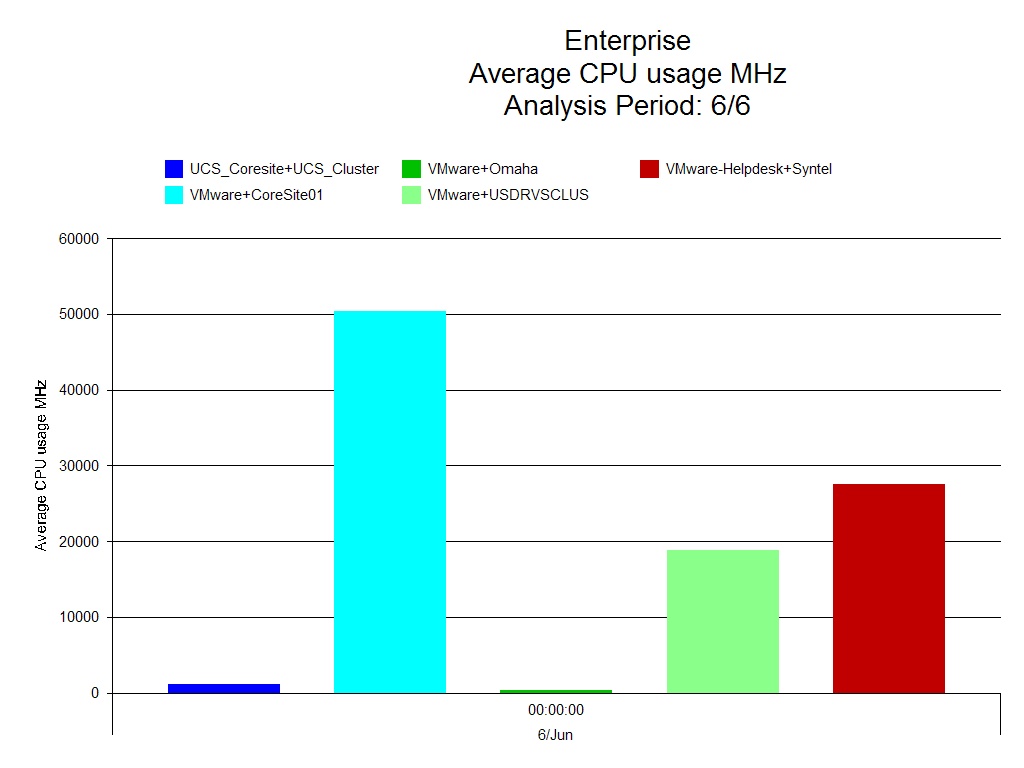
In the example below we’re showing CPU usage. The average CPU usage is illustrated by the green bars, the light blue represents the amount of CPU available across this particular host and the dark blue line is the total CPU power available.

In the example below we’re showing CPU usage. The average CPU usage is illustrated by the green bars, the light blue represents the amount of CPU available across this particular host and the dark blue line is the total CPU power available.
VMware – Virtual Center Headroom

We have aggregated all the hosts up within the cluster to see this information.
We can see from the green area at the bottom how much headroom we have to the blue line at the top, although actually in this case we will be comparing it to the turquoise area as this is the amount of CPU available for the VM’s.
This is due to the headroom taken by VMkernel which has to be taken in to consideration and explains the difference between the dark blue line and the turquoise area.
To summarize my blog series, when reporting:
• Stick to the facts
• Elevator talk
• Show as much information as needs to be shown
• Display the information appropriate for the audience
• Talk the language for the audience
….Tell the Story
Hope you've enjoyed the series, if you have any questions feel free to ask. If you're interested in VMware Capacity Management don't forget to book on to our workshop http://www.metron-athene.com/services/online-workshops/index.html#vmwarevsphere
Charles Johnson
Principal Consultant