So as I mentioned before the question I get asked the most when discussing VMware capacity is “How many more
VMs can I fit in this cluster?”
Which is similar to asking how many balls used for a variety of sports, does it take to fill an Olympic swimming pool? Unfortunately “It depends” is not an acceptable answer for a CIO.
The business wants a number, so as a business focused IT department an answer must be given. The key is that it’s ok to estimate. Anybody who’s compared the average business forecast to what eventually happens in reality, knows the business is ok with estimates.
So how do we figure out the number to tell the business.
If we calculate the size of our average VM, and the size of the cluster, then divide one by the other and that’s the total number of VMs, now just take off the current number of VMs right?
Sounds simple. Except we need to define what’s the size of our cluster. Are we allowing for one or more hosts to fail? Can we identify the size of largest host(s)?
We also need to decide what metrics we are going to size on. Do you want to size on vCPUs to Core ratio, or MHz CPU and MB Memory, or some other limitation?
Can you then calculate what your average VM is at every point during the day and pick the peak or a percentile?
Would you decide to agree on an average size for Small, Medium, and Large VMs, then calculate the number of each currently and extrapolate with the existing ratios?
You have to be able to answer these questions before you can start to do the calculations.
You’ll
need to review the data and make sure it’s a good period to be using for the
exercise.
You
should also try to include the known projects. You might have 1000 VMs currently, but if there are 250 planned for implementation
in the next 6 months you’ll want to take them into account.


Which is similar to asking how many balls used for a variety of sports, does it take to fill an Olympic swimming pool? Unfortunately “It depends” is not an acceptable answer for a CIO.
The business wants a number, so as a business focused IT department an answer must be given. The key is that it’s ok to estimate. Anybody who’s compared the average business forecast to what eventually happens in reality, knows the business is ok with estimates.
So how do we figure out the number to tell the business.
If we calculate the size of our average VM, and the size of the cluster, then divide one by the other and that’s the total number of VMs, now just take off the current number of VMs right?
Sounds simple. Except we need to define what’s the size of our cluster. Are we allowing for one or more hosts to fail? Can we identify the size of largest host(s)?
We also need to decide what metrics we are going to size on. Do you want to size on vCPUs to Core ratio, or MHz CPU and MB Memory, or some other limitation?
Can you then calculate what your average VM is at every point during the day and pick the peak or a percentile?
Would you decide to agree on an average size for Small, Medium, and Large VMs, then calculate the number of each currently and extrapolate with the existing ratios?
You have to be able to answer these questions before you can start to do the calculations.
Clearly
you need data to work with for this. You can manually read info out of vSphere client,
and note it down. But I’d suggest you find a tool to automate the data collection.
E.g.
not during windows updates and a reboot of every VM!
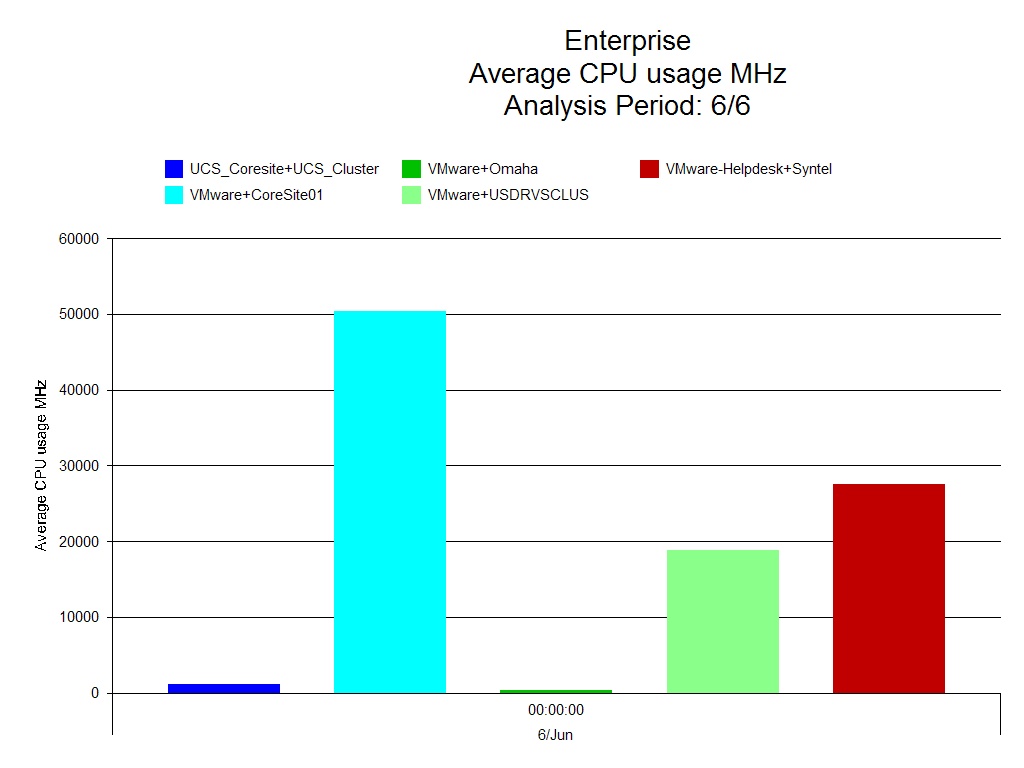
Here’s an example
of a good peak (circled).

The actual
peak is a blip that we don’t
want to size on.
But the circled peak is a nice clean example,
that’s in line with other days.

Given
the size of the cluster in MB Memory and MHz CPU, the number of current VMs,
the size of an average VM, and the size of the largest host I put together a
spreadsheet.
There’s a
calculation that takes the size of
the largest host off the size of the cluster,
then calculates 90% of the result.
Then calculates the number of average
VMs that will fit, and the
space available in average
VMs for both Memory and CPU. The smallest
of the values is then displayed along with either Memory or
CPU as the “Bound By” metric.
Conditional
formatting on a cell displaying the number of VMs available sets a Red, Amber,
Green status.

By
including a sheet that can contain the number of VMs needed for future
projects, then I calculated a second value including them.

Exporting
some of the values I calculated on a regular basis, enables me to then trend
over time, the number
of VMs that are available in the cluster. Still
taking into account
the largest host failing, and
90% of the remaining capacity being the max.
In this case, activity
was actually falling
overtime, and as such the number of VMs available
in the cluster was increasing in terms of CPU capacity.
On Friday I'll do a Round-Up of my series and hope to see some of you at my webinar today.
Phil Bell
Consultant