Tuesday 3 October 2017

Capacity Management Maturity, Assessing & Improving (4 of 4)

Our Capacity Management Maturity Survey helps you to see where your organization scores on the Maturity Scale.

Capacity Management Maturity is not easy to achieve.

Most organizations that have dedicated Capacity Management functions or teams typically score either a 2 or a 3 in this model. Organizations that do not have dedicated teams or functions normally score between a 1 or a 2.

Our survey is a perfect discussion point between the Capacity Manager and management. The results of the survey provide quick feedback on areas to improve.

Using the survey to compare the results for your organization against others in your industry or geography gives an opportunity for you to see where you stack up….possibly identify where you are behind others so that you can catch up.

Take our survey now www.metron-athene.com/survey/

It’s the perfect opportunity to put processes in place that give your organization a competitive advantage over others in your industry.

Don't forget to sign up for our free webinar 'Capacity Management Maturity - Managed to Optimized' 

Rich Fronheiser
Chief Marketing Officer

Friday 29 September 2017

Capacity Management Maturity, Assessing & Improving - 5 levels of process maturity (3 of 4)

As promised today I'll discuss the 5 levels of Capacity Management Maturity and what they mean.
They are:

Level 1 – Initial
Processes are undocumented and in a state of dynamic and chaotic manner. They tend to be driven in an ad hoc, uncontrolled, and reactive manner. Processes at this level tend to be unstable.


Level 2 – Repeatable
Some processes are repeatable, possibly with consistent results. Discipline is unlikely to be rigorous, but where it exists it may help to ensure existing processes are maintained during stressful periods.

Level 3 – Defined
Sets of defined and documented standard processes are established and subject to some degree of improvement over time.

Level 4 – Managed
Using process metrics, management can effectively control processes and identify ways to adjust and adapt the process to particular projects without losses of quality.

Level 5 – Optimized
The focus is on continual improvement through both incremental and innovative changes / improvements

Don't forget to register for our live webinar 'Capacity Management Maturity - Managed to Optimized' which covers how to get from Level 4 to Level 5 in your process. 

The final part of my series is on Tuesday, enjoy your weekend in the meantime.

Rich Fronheiser
Chief Marketing Officer

Wednesday 27 September 2017

Capacity Management Maturity, Assesssing & Improving - Setting the Landscape (2 of 4)

What is Capacity Management?
A fairly standard definition of Capacity Management is:

An IT process that helps ensure capacity meets current and a future business requirements in a cost-­‐effective manner.

A welldefined Capacity Management process will focus on four subprocesses:

Business Capacity Management translating business needs and plans into capacity and performance requirements for services and infrastructure.

Service Capacity Management – managing the capacity of live, operational IT services. This includes both proactive and reactive activities to ensure SLAs are met.

Component Capacity Management managing the performance, utilization, and capacity of IT resources and individual IT components

Capacity Management Reporting – To provide other ITSM processes and management with information related to service and component capacity, utilization, and performance

In order to support the process, specific activities (monitoring, analysis, tuning, modeling, etc.) are undertaken in both proactive and reactive ways.

What is Maturity?

A maturity model is a set of structured levels that describe how well the behaviors, practices, and processes of an organization can reliably produce desired outcomes.

Various models exist. For the purposes of this survey, we’ll focus on the Capability Maturity Model, which consists of five levels of process maturity.

I'll tell you the five levels of process maturity in the Capability Maturity Model on Friday.

Come along to our webinar October 11 'Capacity Management Maturity Series -Managed to Optimized'

Rich Fronheiser
Chief Marketing Officer

Monday 25 September 2017

Capacity Management Maturity - Assessing and Improving the Effectiveness (1 of 4)

Many organizations have a Capacity Management process or function in place, but no practical way to assess the effectiveness or even the strengths and weaknesses of the process or function.


This led to our development and refinement of a Capacity Management Maturity Assessment, consisting of 20 carefully chosen questions that help an organization assess maturity and effectiveness.

Our Capacity Management Maturity Survey is available to complete on line.

Once completed, the results will allow the Capacity Manager to better communicate the importance of Capacity Management and create a plan to fill identified gaps going forward.

Applying this assessment to multiple organizations allows comparisons to be made - between organizations and between an organization and others sharing characteristics such as type of business, geographical location and organizational size, among others.

This blog series will discuss the concept of Capacity Management Maturity, how the concept of maturity is defined and what are the building blocks that reflect a mature process or function within an organization.

Don't forget to register for the final part in our series of 'Capacity Management Maturity webinars  'Capacity Management Maturity - 'Managed to Optimized' '
https://www.metron-athene.com/services/webinars/capacity-management-webinars.html

Rich Fronheiser
Chief Marketing Officer

Monday 18 September 2017

Capacity Management Maturity Series – Managed to Optimized

The final part in our Capacity Management maturity series takes place on October 11 and explains what is expected from a fully mature capacity management process. 

If you have followed this series from the beginning, then you will have seen how the process has evolved from a chaotic/reactive process to a fully integrated business process providing proactive information to enable quicker and more accurate decision making to take place with associated benefits realised faster. If you haven't followed our series and would like to catch up on demand visit our Resources section to watch the previous 3 webinars 

In this webinar, we will cover what it means to be classed as Optimized. More specifically, how IT and Capacity Management can become strategic business partners and how collaboration between CM and the Business enables improvement over all business processes. From being graded as Initial or Repeatable to Defined, Managed or Optimized the overall focus switches from predominately component to service and then business and more specifically what are the potential impacts on revenues. It is at this, the Optimized level, that the embedded automation, process and data sharing integration, and capacity planning contributes most in mitigating service risk/impact and overall IT cost management.

Join us on October 11 to discover what it takes for your CM process to be fully optimized.

In the meantime if you'd like to find out where your organization is on the maturity scale then take our survey and get your free 20 page report.

Jamie Baker
Principal Consultant


Wednesday 13 September 2017

Managing your IBM z System licensing charges - Ways to Manage Cost (5 of 5)

Today I'll take a look at ways to manage cost and provide a summary of my series.
Some of the ways in which you can look at reducing or managing costs are below and we'll start with zIIP Processors.

zIIP Processors

        Specialty processors for offloading work

        Workloads using zIIP Processors do not factor into the License Charges

        Originally setup for DB2 in 2004

        Work run on zAPPs can run on zIIPs (i.e. Java)

        Third party products can use zIIPs with API licensed from IBM

        Talk to your vendors

Bottom line

        Lowers cost of computing for eligible workloads
To Cap or not to Cap?

Capping the Environment is a means of Manual or Automatic control of resources to ensure the MLC is stable but optimize the system performance.Modification of the LPARs Defined Capacity (DC) to account for workload behavior and the needs of all the LPARs.
Soft Capping Manually

There are some issues with Soft Capping manually:

        Personnel constantly monitoring
        Adjustments may not be made in time
        Possible errors causing unsuspected results
Soft Capping – Automating the Process
Automating Soft Capping makes the process much easier.
        The LPARs’ DCs (Defined Capacity) are dynamically modified by taking into account the behavior and needs of all the LPARs.
        When one LPAR requires capacity to handle an instantaneous workload increase, its  DC can be dynamically increased, temporarily, while other less- busy LPARs can have their DCs reduced  temporarily.
        When the demand for extra capacity has passed, all of the LPAR DCs are returned to their normal levels, based on the CPC DC aggregate.
        Software tools are available to assist in the process
Summary
In summary, in order to manage your IBM z System licensing charges you need to:
        Understand the components of the MLC
        Understand your negotiated pricing mechanism

Check out our Resources section for some great white papers and on-demand webinars on z Systems  https://www.metron-athene.com/resources/index.asp

Charles Johnson
Principal Consultant


Monday 11 September 2017

Managing your IBM z System licensing charges - Reporting to manage your monthly license charges(4 of 5)


There are many Reporting Processes but those that are useful in helping you manage your monthly license charges are below:
        Analyze the Peak Workloads

        Review workload placement - can workloads be combined onto a single LPAR?

        zIIP processor usage
Some examples below of the type of reports you can create, these have been produced using our athene® ES/1 product.

athene® ES/1- Rolling 4 Hour Average

athene® ES/1- Rolling 4 Hour Average w/ Service Classes

How to calculate MLC
        Calculation is made for the period from the 2nd day of the month to the 1st day of the next month.
        MLC is charged based on the maximum value of total R4HA MSU of all LPARs during the calculation period.
        Charge for each IBM software product is made for the period while the product is running. (Except z/OS)
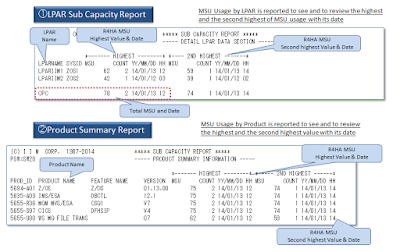
SCRT – Sub-Capacity Report Tool

athene® ES/1 provides all the information used with the SCRT(Sub Capacity Report Tool).  The information provided is shown from the LPAR and Product perspective.
Shown on the report are the highest and second highest values and the date/time they occurred. 

Sample Charts for IBM MLC

athene® ES/1 product usage
Helping you to correlate software charges and application usage.
Business Transactions vs. CPU Usage – Change chart 

On Wednesday I'll conclude my series with a look at the way you can manage costs, on that day I'll also be broadcasting live with my 'Top 5 z Systems Capacity Issues' - make sure you register for your place. 
Charles Johnson
Principal Consultant