Friday 27 May 2011

Capacity Management can ensure the success of your Green IT initiative

Come along to St Paul’s Cathedral on Tuesday 7th June and find out how
Capacity Management can ensure the success of your Green IT initiative.

We’re holding a FREE seminar in The Crypt at St Paul’s showing the inter-relationship between Green IT, Cloud and Virtualization.

Virtualization enables Cloud enables Green IT.

However, ease of infrastructure roll out can lead to wasted resources, elasticity of the Cloud can mean over-use of resources carrying a premium cost and then your carbon footprint won’t fall as much as anticipated.

As ever, one needs to plan to succeed.

Metron and athene® bring you the knowledge and the tools to plan to maximize the benefits from these technologies, without incurring any unnecessary overheads.

In addition to some sparkling presentations and discussion about capacity management for Green IT, Cloud and Virtualization, the seminar includes a private guided tour of St Paul’s.

Places are limited, so contact us now to reserve your place...we hope to see you there.

Andrew Smith
Chief Sales & Marketing Officer

http://www.metron-athene.com/training/seminars/cloud_virtualization_greenIT_seminar.html

Monday 23 May 2011

‘Whatif’scenarios can be quickly evaluated and the bottlenecks revealed

We’ve looked at monitoring,analysis and automated reports so let’s turn our attention to modelling reports...


The plots shown here are an indication of the sorts of results that can be achieved when a particular service has been analyzed across a multi-tier solution and models of each node derived.

‘Whatif’scenarios can be quickly evaluated and the bottlenecks revealed, ready for further drill-down analysis to determine the best options for action.

The use of relevant graphics can highlight issues quickly.

These are all indicative of the sort of reporting done in the UK and USA, but less so in

Japan, where the case study is based and has an emphasis on monitoring, but with a BPI
Perspective.

We have found a variety of ways of analysing the relevant data. We now need to present the
findings as useful information.

Employers tend to feel that a new IT issue is yet more pie in the sky so it is necessary to show them that IT contributes to business in order to regain their trust in IT.

We must show them how much contribution IT has made to increases of revenue and profit with actual results and figures.

On Wednesday the final part of my series will take a look at IT Service Management...


Adam Grummitt
Distinguished Engineer and Author ‘Capacity Management – A Practitioner Guide’

http://www.itgovernance.co.uk/products/3077

A selection of more white papers are available for free download http://www.metron-athene.com/_downloads/index.html


Friday 20 May 2011

Automated Capacity Management reports

So let’s view some typical automated reports


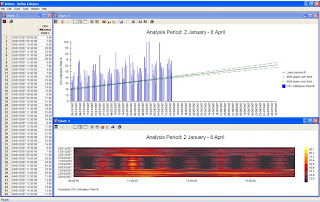
The example report above is typical of those used within the capacity management team (CMT).

There is usually also a requirement to publish the performance reports for servers automatically to an intranet for others to exploit (though not many sites seem to keep a check on the use made of the data outside the CMT).

Typically some form of explorer based interface will enable the choice of relevant servers or services for different users to pursue their own issues.

In most sites of significant size, this whole process is automated and the reports standardized as much as practical to make it easy to comprehend reports, no matter what detailed architecture lies beneath.

Ron Kaminski has published many excellent articles on this subject, ranging from the use of
standard colours for predefined workloads and automatic identification of process pathologies to using sparklines (see Edward Tufte) to highlight anomalies.

The more computational intelligence, correlation, advice and guidance that can be automated and incorporated in the reporting regime, the better.

The more a standard GUI will enable ready drill down and comparison, the better. The more short term anomalies and long term trends that can be readily identified, the better.The more process pathology that can be automatically used to reveal ramps (unending upward incremental trends), leaks, loops and other issues, the better.

A standard interface, explorer-like access and highlighted exceptions will help users avoid becoming saturated with too much detail.

Next week I'll be looking at modelling reports...


Adam Grummitt

Distinguished Engineer and Author ‘Capacity Management – A Practitioner Guide’

http://www.itgovernance.co.uk/products/3077

A selection of more white papers are available for free download http://www.metron-athene.com/_downloads/index.html


Thursday 19 May 2011

What interactive reports and analyses should you be producing?

So what interactive reports and analyses should you be producing?

Reporting considerations 

- What information is really useful?

- What data is needed and are the metrics available?

- How to present/use the reports?

Analysis by service, workload, server, resource

Summaries and exception reports (all to defined standards)

Comparison of actual and target

- setting targets

- workload volume, resource consumption, trends

- service level achievement, costs, BPI

Ideally (or maybe not) complete coverage:

- all platforms, resources, workloads, services, costs

Resource accounting

- be able to say who is using what and how efficiently

Identification of areas needing attention

- focussing attention to where it is needed, bottlenecks, leaks, loops

- trends, alerts, exception management

Providing reassurance that all targets are being met

- Not just tons of data and loads of graphs.


The monitoring and analysis report shown here is typical of the sorts of report that a performance and capacity team will look at for a large number of services and servers. Ideally many of the reports will be automated to reflect unusual correlations or excessively busy users (and ideally unusual patterns such as ramps reflecting memory leaks or program loops).

There is an inclination to use excessive bar charts and other basic standard Excel-like plots in reports, which is understandable given the need to automate. However, it is worth considering past experience to try to highlight information as appropriate.

 Tufte has coined the word ‘sparkline’ to reflect the use of simplified graphics within text to highlight key patterns and some apply this to web-based performance reporting. Some exploit ‘hotspot’ to describe performance charts using medical-style color 2D surface-contours. Some use traffic lights or thumbnails to highlight server nodes with issues.

 We’ll look at automated reports next....


Adam Grummitt
Distinguished Engineer and Author ‘Capacity Management – A Practitioner Guide’

http://www.itgovernance.co.uk/products/3077

A selection of more white papers are available for free download http://www.metron-athene.com/_downloads/index.html

Monday 16 May 2011

Few employers say “No” to an investment if it has a high enough return on investment in a short enough timescale

It is important to explain the relationship between business performance and its IT service provided to the business by using an indicator that shows the result of the business.  

Business Performance Indicator is abbreviated to BPI. It is effectively a business level Key Performance Indicator (KPI) and given other names such as Metric of Interest or Service Quality Level.
 

• Take an inventory of the applications making up the IT service and classify those applications by business function.

• Prioritize the applications as classified by their business function.

 • Usage of each application classified by business function should be measured to establish
a baseline and the degree of usage can be identified compared with the priority.

It is effective to use application logs that are stored to close events on records if it is available. For instance, a Web application has an http log which includes the number of accesses and response time to each URL. This information can be used to analyze the usage of each business function.

 • This BPI must be an indicator that shows the result of a business function such as the
amount of revenue or profits, improvement rate of productivity or reduction rate of cost.

 • The BPI should have a time stamp to be able to compare the usage of application by business function in same time scale. The contribution to the business can be seen by correlating the BPI and the usage of the application.

• Unit costs of an application by usage, such as by each access or by each transaction, can
be calculated by dividing the degree of application usage into the total cost of the application
including the expenditure for development, maintenance and operation.

This brings the benefit of explaining how the application contributes to its business by comparing the total and unit cost with the results of the BPI.

This approach is achieved in Metron by using a ‘metrics matrix’ to develop the business drivers and BPI information needed, related SLA targets and constraints for each, which are then mapped into resource/component metrics to be measured and reported.

Few employers say “No” to an investment if it has a high enough return on investment in a short enough timescale.

 IT infrastructure may be thought of as being similar to a production line in the manufacturing industry.The product of IT infrastructure is IT service. The production line must have a capability to produce competitive products with expected quality. Investment in the IT infrastructure must be made to adopt the demands by improving and expanding its capabilities associated with business plan and strategy.

If the IT service currently provided is not being used at the expected usage level, we should consider whether the IT service can be disposed of because there is little value from the IT service. By doing this, we can reduce the fixed expenses for maintenance of the IT service and we can also apply the resource and staff spent on the IT service to other IT services.

 It is important to improve the productivity and skill of IT staff engaged in providing the IT services.

 We have to redistribute human resource to the right place, where they can display their ability based on the productivity. All of which can be maximized by outsourcing or in-sourcing.

The capacity planner should be trained or hired in the company.

We should not outsource this management process because it is best done by people who know the business and culture of the company and have an ability to communicate with users at LOB. They can explain the validity of an IT investment to employers as decision makers by using the information of how much the IT service contributes to its business. Of course, that does not preclude using consultants to act.

On Wednesday we’ll look at the interactive reports and analyses you should be producing.


Adam Grummitt
Distinguished Engineer and Author ‘Capacity Management – A Practitioner Guide’
http://www.itgovernance.co.uk/products/3077

A selection of more white papers are available for free download http://www.metron-athene.com/_downloads/index.html

Tuesday 10 May 2011

capacity management can be proactive making a major contribution to the business

There are five ‘So-called Objectives’ of IT Service Management.
These are ‘so-called objectives’ because they identify an ideal. Reality is very different.
I’ll discuss the objectives in terms of the goals to be attained, the costs in different countries and their proportions of the GDP in each, the attitudes to investment in IT in different countries, and the country culture with respect to the balance between chasing new prospects and supporting existing users.
All ITSM objectives are important, but the key objective is often forgotten. The ultimate objective is to increase revenue and profit and this is its true contribution to the business sphere.
Everybody concerned with business has to address the twin problems of increasing productivity while reducing costs. This is the ultimate goal of ITSM and it is affected by five main factors:

• increase productivity

• reduce costs

• do new things

• win competitions

• provide IT services.

The ultimate goal is common to all countries, but the emphasis on the different factors involved varies.

The big question is how to increase Revenue and Profit and there are two main strategies:

 
• Do something new creating new products or services, or expanding into new markets.

• Differentiate yourself from competitors, in order to hold a dominant position and beat their attempts to control the market.

By being effective in these two areas the company will increase productivity and reduce costs.

The important point is that IT service provision can help and support these areas.Employers’ misgivings about IT investment are in these first two areas and to answer that, we must explain how the IT service contributes to the business itself.
It is important to divide IT services into direct and indirect, as related to business results. So we should divide IT into two groups:

• IT services that have a direct influence outside the company such as on customers, clients and partner companies.

• IT services that influence only internal users within the company.

Then prepare an explanation for management of the degree of contribution that each IT service makes in order to reach the right decisions.
This brings benefit in that we can prioritize the service level of each IT service based on the importance to the business, so that then we can control the service level according to the business priority.
In this way, meaningful reports can be produced and presented to help in business decision making.
It is in this way that capacity management can be proactive and make a major contribution to the business. Capacity management done reactively and passively is inherently done badly and also makes it seem an overhead to be minimised.

Next time I’ll be looking at what considerations should be involved in effective reporting and what kind of reports should be provided..so keep following. 

 
Adam Grummitt
Distinguished Engineer and Author ‘Capacity Management – A Practitioner Guide’

http://www.itgovernance.co.uk/products/3077

A selection of more white papers are available for free download http://www.metron-athene.com/_downloads/index.html

Wednesday 4 May 2011

Ever wondered what cloud computing really is?


What do SaaS, Paas and Iaas actually mean? 

I'm interested in how effective Capacity Management,within an internal cloud underpinned by VMware vSphere, can be.

I believe it can reap many benefits including:


·         significant cost reductions (monetary and environmental)

·         protecting critical services and avoiding costly SLA breaches

·         avoiding over or under provisioning for both ESX hosts and VMs

There are also advantages which come from performing Application Sizing, decisions need to be made on whether you scale the vSphere infrastructure out / up or in and what essential Capacity Management processes and information are required to ensure a brighter outlook for your vSphere Internal Cloud environment.

 Join me on my free webinar ‘VMware vSphere -Avoiding an Internal Storm?’ tomorrow Thursday May 5th where I’ll be discussing this topic in more detail.

Register for your free place now 


I look forward to seeing you there


Jamie Baker

Principal Consultant

Tuesday 3 May 2011

Doing more with less is the prevalent theme these days....


The ‘more’ to be done usually means more applications in more services on more servers for
more users of more critical business requirements. This means trying to automate as much
analysis and reporting as possible to be applied to increasing numbers of machines, both real
and virtual.

More
Critical business requirements for IT service and web
Users - Business customers, end-users and clients
Services - Business customers’ view of applications
Architectures - abstraction, virtualization, consolidation
Tiers & pools, Web GUI, message handler, app server…
Applications, developments in-house, off-shore, packages…
Servers, machines, nodes, CPUs, RAM, networks, storage
Less
Overhead – IT infrastructure and services
Finance – budgets cut
Sites – consolidated data-centres
Staff – cutbacks
Spare capacity – headroom, duplex, DR, non-stop
Physical servers – virtualised and consolidated
Expertise – less experience and less training
‘Inefficiency’ but at what risk?

Hardware is cheap but other resources are limited, so why or when should you do planning, or
testing, or monitoring?
Follow my series to find out how capacity management plays a critical role in achieving these objectives.
Adam Grummitt
Distinguished Engineer and Author ‘Capacity Management – A Practitioner Guide’
For  free access to Adam's white papers join our community http://www.metron-athene.com/_downloads/_published_papers/index.html