So let’s view some typical automated reports
Next week I'll be looking at modelling reports...
Adam Grummitt

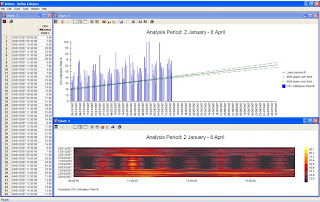
The example report above is typical of those used within the capacity management team (CMT).
There is usually also a requirement to publish the performance reports for servers automatically to an intranet for others to exploit (though not many sites seem to keep a check on the use made of the data outside the CMT).
Typically some form of explorer based interface will enable the choice of relevant servers or services for different users to pursue their own issues.
In most sites of significant size, this whole process is automated and the reports standardized as much as practical to make it easy to comprehend reports, no matter what detailed architecture lies beneath.
Ron Kaminski has published many excellent articles on this subject, ranging from the use of
standard colours for predefined workloads and automatic identification of process pathologies to using sparklines (see Edward Tufte) to highlight anomalies.The more computational intelligence, correlation, advice and guidance that can be automated and incorporated in the reporting regime, the better.
The more a standard GUI will enable ready drill down and comparison, the better. The more short term anomalies and long term trends that can be readily identified, the better.The more process pathology that can be automatically used to reveal ramps (unending upward incremental trends), leaks, loops and other issues, the better.
A standard interface, explorer-like access and highlighted exceptions will help users avoid becoming saturated with too much detail.
Next week I'll be looking at modelling reports...
Distinguished Engineer and Author ‘Capacity Management – A Practitioner Guide’
http://www.itgovernance.co.uk/products/3077
A selection of more white papers are available for free download http://www.metron-athene.com/_downloads/index.html
A selection of more white papers are available for free download http://www.metron-athene.com/_downloads/index.html
No comments:
Post a Comment