Let’s take a look at some examples of VMware reports.
The first report below looks at the CPU usage of clusters in MHz. It is a simple chart and this makes it very easy to understand.

You can immediately see who the biggest user of the CPU is, Core site 01.
 A trend report like this is useful as an early warning system, you know when problems are likely to ensue and can do something to resolve this before it becomes an issue.
We need to keep ahead of the game and setting up simple but effective reports, provided automatically, will help you to do this and to report back to the business regarding requirements well in advance.
On Thursday I’ll show you one final report on VMware, which looks at headroom available in the Virtual Center, in the meantime take a look at out VMware vSphere Capacity and Performance Essentials workshop.
http://www.metron-athene.com/services/online-workshops/index.html#vmwarevsphere
Charles Johnson
Principal Consultant
The first report below looks at the CPU usage of clusters in MHz. It is a simple chart and this makes it very easy to understand.
VMware – CPU Usage all Clusters
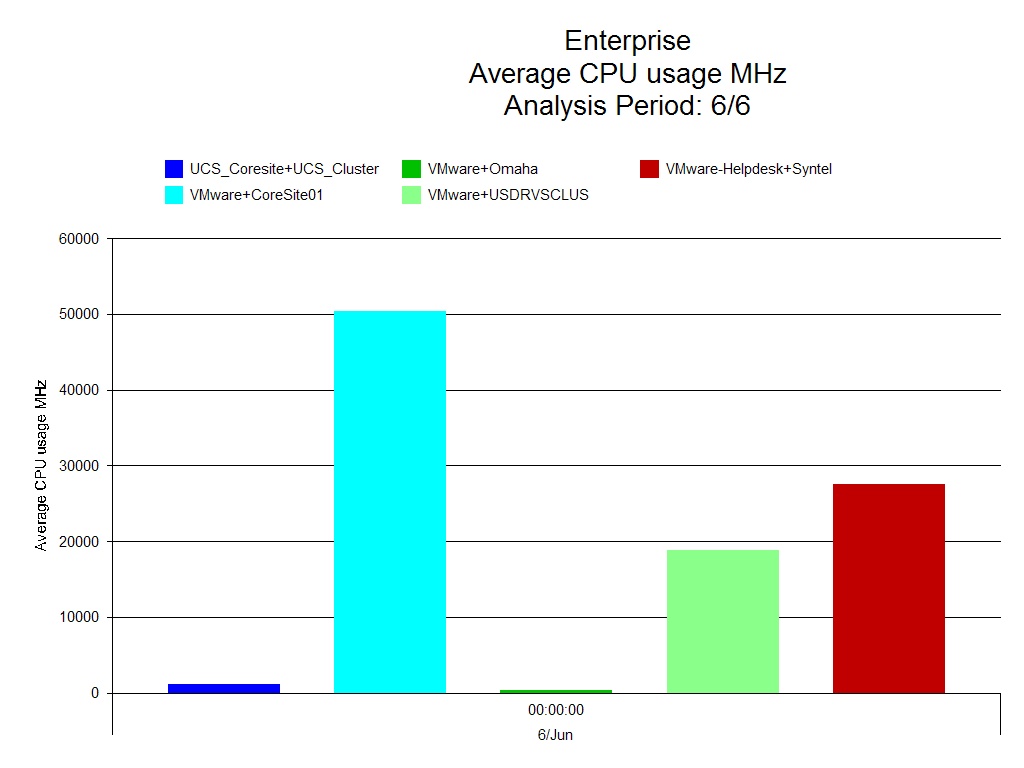
You can immediately see who the biggest user of the CPU is, Core site 01.
The next example is a trend report on VMware resource pool memory usage.
The light blue indicates the amount of memory reserved and the dark blue line indicates the amount of memory used within that reservation. This information is then trended going forward, allowing you to see at which point in time the required memory is going to exceed the memory reservation.
VMware – Resource Pool Memory Usage Trend

We need to keep ahead of the game and setting up simple but effective reports, provided automatically, will help you to do this and to report back to the business regarding requirements well in advance.
On Thursday I’ll show you one final report on VMware, which looks at headroom available in the Virtual Center, in the meantime take a look at out VMware vSphere Capacity and Performance Essentials workshop.
http://www.metron-athene.com/services/online-workshops/index.html#vmwarevsphere
Charles Johnson
Principal Consultant
No comments:
Post a Comment